How to Read Commodity Options Chains for Better Trade Planning
By : Admin -
Understanding Commodity Options Chains
Commodity options chains are structured displays of all available options contracts for a specific underlying commodity, organized by expiration date. They play a central role in derivatives trading because they consolidate relevant pricing and activity data into a single framework. By studying an options chain, traders can assess market expectations, identify liquidity conditions, and evaluate the relative attractiveness of various strike prices. A systematic understanding of how these chains are constructed and interpreted allows market participants to align their strategies with prevailing conditions in futures and spot markets.
Commodity markets differ from equity markets in several important respects, including storage costs, seasonality, delivery specifications, and sensitivity to macroeconomic data. As a result, the interpretation of options chains on commodities such as crude oil, gold, corn, or natural gas requires attention to market-specific dynamics. Nevertheless, the foundational logic behind options pricing and contract structure remains consistent: options derive their value from the underlying futures contract, and their pricing reflects supply, demand, time, and anticipated volatility.
Basic Structure of an Options Chain
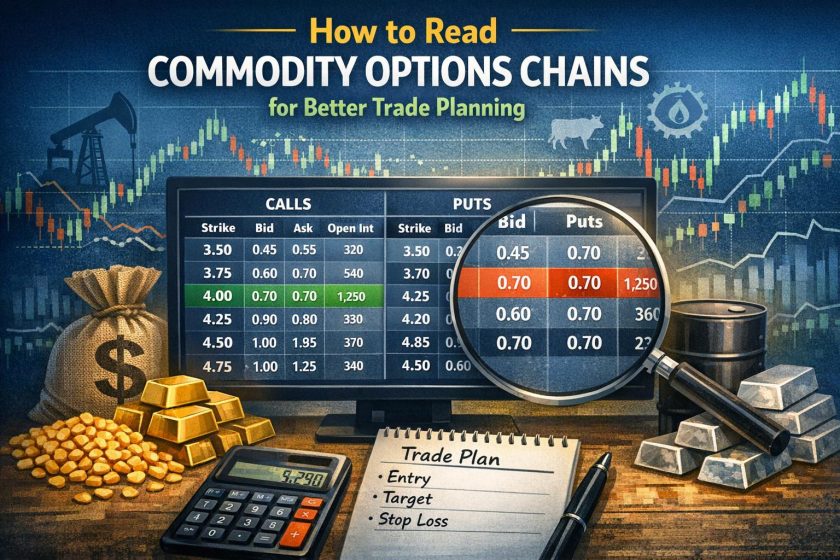
An options chain presents calls and puts side by side for a single expiration date. Each row typically corresponds to a strike price, while columns display pricing and activity metrics. The organization enables traders to compare premiums across strikes and between calls and puts, which is essential for understanding the distribution of market expectations.
The strike price represents the predetermined level at which the holder of the option can buy or sell the underlying commodity futures contract. Strike prices are listed in ascending order, and their spacing depends on the commodity and prevailing price level. For actively traded commodities, strike intervals are often narrow, allowing precise positioning.
The premium is the cost of acquiring the option. This price reflects a combination of intrinsic value and time value. Intrinsic value exists when an option is in the money, meaning its strike price is favorable relative to the current futures price. Time value reflects the probability that the option may gain intrinsic value before expiration. Premiums fluctuate throughout the trading session as the underlying futures price and implied volatility change.
The bid and ask prices represent the highest price buyers are willing to pay and the lowest price sellers are willing to accept. The difference between these two figures is known as the spread. Narrow spreads typically indicate higher liquidity, while wider spreads may signal lower trading activity or elevated uncertainty.
Volume indicates the number of contracts traded during a specified period, often the current session. High volume suggests active participation at a particular strike. Open interest measures the total number of outstanding contracts that remain open at the end of the trading day. Whereas volume reflects daily activity, open interest signals the level of ongoing commitment by market participants.
Together, these data points form the analytical foundation for evaluating opportunities. Rather than viewing each number in isolation, traders interpret them collectively to identify patterns that may indicate directional bias, hedging pressure, or speculative positioning.
Call Options and Their Implications
A call option grants the holder the right, but not the obligation, to buy a commodity futures contract at the specified strike price before or on expiration. Calls are commonly used when traders anticipate rising prices, but they also serve in more complex strategies involving spreads or volatility positioning.
Within the options chain, calls are usually listed on one side of the strike price column. As the strike price increases, call premiums generally decrease, assuming all other factors remain constant. This occurs because higher strike calls have a lower probability of expiring in the money. However, during periods of elevated volatility, even out-of-the-money calls may carry significant premiums due to expanded expectations of price movement.
The relationship between the underlying futures price and the strike price determines whether a call option is categorized as in the money, at the money, or out of the money. An in-the-money call has a strike price below the current futures price. An at-the-money call has a strike approximately equal to the current futures price. An out-of-the-money call has a strike above the current level. These distinctions are significant because they influence sensitivity to price changes, as measured by option Greeks such as delta.
Open interest in call options can reveal concentrations of positioning. For example, substantial open interest at a specific strike may indicate that traders perceive that level as significant for future price movement. In some cases, these concentrations align with technical resistance or widely observed price targets.
Evaluating Put Options
Put options provide the right to sell a commodity futures contract at a predetermined strike price. They are often employed to benefit from declining prices or to hedge existing long exposures. In agricultural markets, for instance, producers may use puts to protect revenue against adverse price movements. In energy or metals markets, investors might use puts to manage downside risk.
In an options chain, put premiums generally increase as strike prices rise, assuming other variables remain constant. Higher strike puts grant the right to sell at more favorable terms, making them more expensive. As with calls, the classification of puts into in-the-money, at-the-money, or out-of-the-money categories depends on the relationship between the strike and the underlying futures price.
Put open interest sometimes serves as an indicator of hedging demand. Elevated open interest in out-of-the-money puts can suggest that market participants are concerned about downside risk. However, interpretation requires context. High open interest might reflect previously established positions that no longer represent current sentiment. Analysts often compare changes in open interest from day to day to determine whether new positions are being added or existing ones are being closed.
By comparing call and put data across strike prices, traders gain a broader understanding of how risk is distributed in the market. Discrepancies in volume or open interest between the two sides of the chain may imply differing expectations regarding potential price direction.
Expiration Cycles and Contract Specifications
Commodity options are linked to specific futures contracts with predefined expiration cycles. Unlike equities, which typically offer monthly expirations, commodity markets may include seasonal delivery months reflecting production and consumption cycles. For example, agricultural commodities often have expirations aligned with planting and harvest periods. Energy contracts may reflect refinery maintenance cycles or inventory reporting schedules.
The options chain is organized by expiration date, and each expiration has distinct pricing characteristics. Options with more time remaining until expiration typically exhibit higher premiums due to greater time value. As expiration approaches, time decay accelerates, gradually eroding the extrinsic component of the premium. This phenomenon, known as theta decay, is visible across the chain when comparing near-term and longer-dated options.
Understanding contract specifications is essential. Commodity options usually represent a standardized quantity of the underlying futures contract. For example, a single crude oil option may correspond to a futures contract representing 1,000 barrels. This scale determines the total exposure and financial commitment required. By examining the options chain alongside contract specifications, traders can calculate potential profit and loss scenarios more accurately.
Analyzing Option Data for Trade Planning
Analyzing an options chain is not limited to reviewing premiums. Traders evaluate patterns in volume and open interest to determine whether participation is concentrated at certain strike prices. If both volume and open interest increase significantly at a particular strike, it may indicate the establishment of new positions rather than routine closing trades.
Changes in open interest provide insight into market dynamics. Rising open interest alongside rising futures prices can signal that new long positions are being initiated. Conversely, declining open interest during price advances might suggest short covering. These interpretations are not definitive but contribute to a structured assessment of positioning trends.
The bid-ask spread also plays a practical role in trade planning. Wider spreads increase transaction costs, particularly for strategies involving multiple legs such as spreads or straddles. Traders seeking efficient execution often prioritize strikes and expirations with higher liquidity, as evidenced by tighter spreads and consistent volume.
Another aspect of chain analysis involves comparing implied volatility across strikes, a pattern commonly referred to as the volatility skew. In many commodity markets, out-of-the-money puts carry higher implied volatility than calls, reflecting demand for downside protection. Observing how this skew evolves can provide information about shifts in perceived risk.
Monitoring Implied Volatility
Implied volatility represents the market’s consensus estimate of future price variability derived from option premiums. Unlike historical volatility, which measures past price fluctuations, implied volatility reflects forward-looking expectations. It is therefore one of the most significant components of any options chain.
Higher implied volatility leads to higher option premiums, all else being equal. This effect applies to both calls and puts. Traders monitor implied volatility to determine whether options appear relatively expensive or inexpensive compared with historical norms. When implied volatility is elevated, strategies that sell options may generate larger premiums, though they also involve exposure to unpredictable price movement. When implied volatility is low, long option strategies may be comparatively less costly but require sufficient price movement to offset time decay.
Implied volatility is displayed for each strike and expiration in most options chains. By comparing values across the term structure, traders can assess whether near-term uncertainty differs from longer-term expectations. Short-dated options often exhibit sharp volatility changes around scheduled reports, geopolitical developments, or seasonal events. Longer-dated options may reflect structural supply and demand considerations.
Effective monitoring of implied volatility involves examining both its absolute level and its relative position within historical ranges. Consistency between volatility trends and price trends may reinforce market assessments, while divergences can signal potential adjustments in sentiment.
Integrating Options Chain Analysis into Broader Strategy
While the options chain provides detailed numerical information, its usefulness depends on integration with broader market analysis. Commodity traders frequently combine chain interpretation with technical indicators, fundamental supply-demand assessments, and macroeconomic data. For example, in energy markets, inventory reports and production levels can influence volatility expectations, which in turn affect option pricing throughout the chain.
Risk management considerations are central to this integration. By observing how premiums change relative to futures price movement, traders can estimate sensitivity measures such as delta and gamma. These metrics indicate how much an option’s value is likely to change in response to underlying price shifts. Although the options chain may not directly display all Greeks, many platforms provide them alongside chain data, allowing for more comprehensive planning.
Position sizing decisions also rely on chain analysis. Evaluating open interest, volume, and spreads helps determine whether a position can be entered and exited with minimal disruption. In less liquid commodities, insufficient liquidity at certain strikes may necessitate adjustments to strategy selection.
Commodity options chains function as structured representations of collective market positioning. By understanding their layout, interpreting pricing relationships, monitoring volatility metrics, and assessing activity indicators, traders can make decisions grounded in observable data. Systematic evaluation of these elements enhances the capacity to construct strategies aligned with prevailing market conditions and defined risk parameters.
This article was last updated on: March 15, 2026